
ROAS (return on ad spend) measures how much attributed revenue each advertising dollar produces. ROI (return on investment) measures profit against everything the marketing cost. ROAS tells a growth team whether a campaign is efficient. ROI tells the business whether the campaign was worth running. For crypto, fintech, forex and e-commerce teams, where margins, compliance costs and payback periods differ widely, reading the two together prevents the most expensive mistake in paid acquisition: scaling a campaign that looks strong on revenue and loses money on profit.
TL;DR
- ROAS = revenue attributed to ads ÷ ad spend. It ignores product cost, fees, shipping, overhead and agency cost.
- ROI = (net profit ÷ total investment) × 100. It includes every cost tied to the campaign.
- A ROAS target is only meaningful next to a break-even ROAS, which is 1 ÷ contribution margin. At a 40% margin, break-even is 2.5.
- Use ROAS to steer day-to-day bidding and creative. Use ROI to decide budgets, channels and whether to continue.
- The same logic applies to SEO vs PPC: paid search pays back faster, organic compounds more slowly, and each needs its own measurement window.
Table of Contents
- What ROAS and ROI each measure
- How to calculate each metric
- Converting ROAS to ROI: a worked example
- What ROAS is good? Start with break-even
- When to use ROAS, ROI or both
- ROAS, ROI and the SEO vs PPC decision
- A reporting setup that holds up
- How Metrics & Co. fits in
- FAQ
- Sources
What ROAS and ROI each measure
Shopify’s 2026 guide defines ROAS as ad-attributed revenue divided by ad spend, a measure of revenue efficiency rather than profit. ROI, in the same guide, is net profit divided by total investment cost, multiplied by 100, and its scope includes non-ad expenses. A university digital-marketing text from the University of New Hampshire frames it the same way: ROAS is specific to advertising, ROI is a profitability measure for the organization, and a campaign can look effective under ROAS while losing money overall.
The practical difference is scope:
| ROAS | ROI | |
|---|---|---|
| Question answered | How much revenue did each ad dollar bring in? | Did this spend make money after all costs? |
| Numerator | Attributed revenue | Net profit |
| Denominator | Ad spend | Total investment cost |
| Typical unit | Ratio (4.0 or 4:1) | Percentage (33%) |
| Best for | Campaign, ad set and creative decisions | Budget, channel and strategy decisions |
| Blind spot | Margins, fixed costs, fees, agency cost | Slower to calculate, harder to attribute |
Amazon’s advertising guide makes a related point: ROAS compares a specific campaign’s revenue with its spend, while ROI can include broader costs such as agency support. That is why two teams can report the same campaign with very different numbers and both be correct.
How to calculate each metric
ROAS
ROAS = revenue from ads ÷ ad spend. Spend $10,000 on a campaign that records $40,000 in attributed revenue and ROAS is 4.0, often written 4:1 or 400%.
The weak point is the numerator. Attributed revenue depends on the attribution model, the lookback window and whether the platform counts sales that would have happened anyway. Branded search is the clearest case, which is why measuring incrementality matters; the Metrics & Co. article on crypto brand search incrementality covers how to separate demand the ads created from demand they merely captured.
ROI
ROI = (net profit ÷ total investment cost) × 100. Shopify’s guide lists the costs to account for: product manufacturing, shipping and fulfillment, payment fees and operating expenses. For a marketing-specific ROI, Smart Insights notes that a fuller PPC estimate can include team time, campaign setup and analysis, landing-page production and third-party tools alongside media spend. Monday.com’s marketing ROI guide adds agency or contractor fees, software, allocated salaries and creative production.
For a fintech, crypto or forex brand, the equivalents of product cost are different. They typically include payment-processing and on-ramp fees, KYC and compliance review costs, referral or revenue-share payouts and promotional bonuses. Whatever the model, the rule is the same: every cost that exists because the campaign exists belongs in the denominator.
Converting ROAS to ROI: a worked example
ROAS cannot be converted to ROI without one more number: the contribution margin, meaning the share of each revenue dollar left after variable costs such as product cost, shipping, payment fees and per-order costs, before advertising.
Take an e-commerce brand with these figures for one month:
- Ad spend: $10,000
- Attributed revenue: $40,000, so ROAS is 4.0
- Variable costs (product, shipping, payment fees): 60% of revenue, so contribution margin is 40%
- Agency and creative fees for the campaign: $2,000
The steps:
- Contribution before advertising: $40,000 × 40% = $16,000
- Total campaign investment: $10,000 ad spend + $2,000 fees = $12,000
- Net profit: $16,000 − $12,000 = $4,000
- ROI: $4,000 ÷ $12,000 × 100 = 33%
The same campaign has a healthy-looking 4.0 ROAS and a 33% ROI. Change the margin to 25% and contribution drops to $10,000, which does not cover the $12,000 investment: ROI is −17%, with an unchanged ROAS of 4.0. That gap is the reason ROAS cannot stand alone.
If agency fees are ignored, the ad-only shortcut is: ROI on ad spend = (ROAS × contribution margin) − 1. At 4.0 and 40%, that is 1.6 − 1 = 0.6, or 60%. The difference from 33% is the $2,000 in fees, a reminder that the ROI figure moves with whichever costs are included. A team should fix its cost definition once and apply it to every channel so that comparisons stay fair.
What ROAS is good? Start with break-even
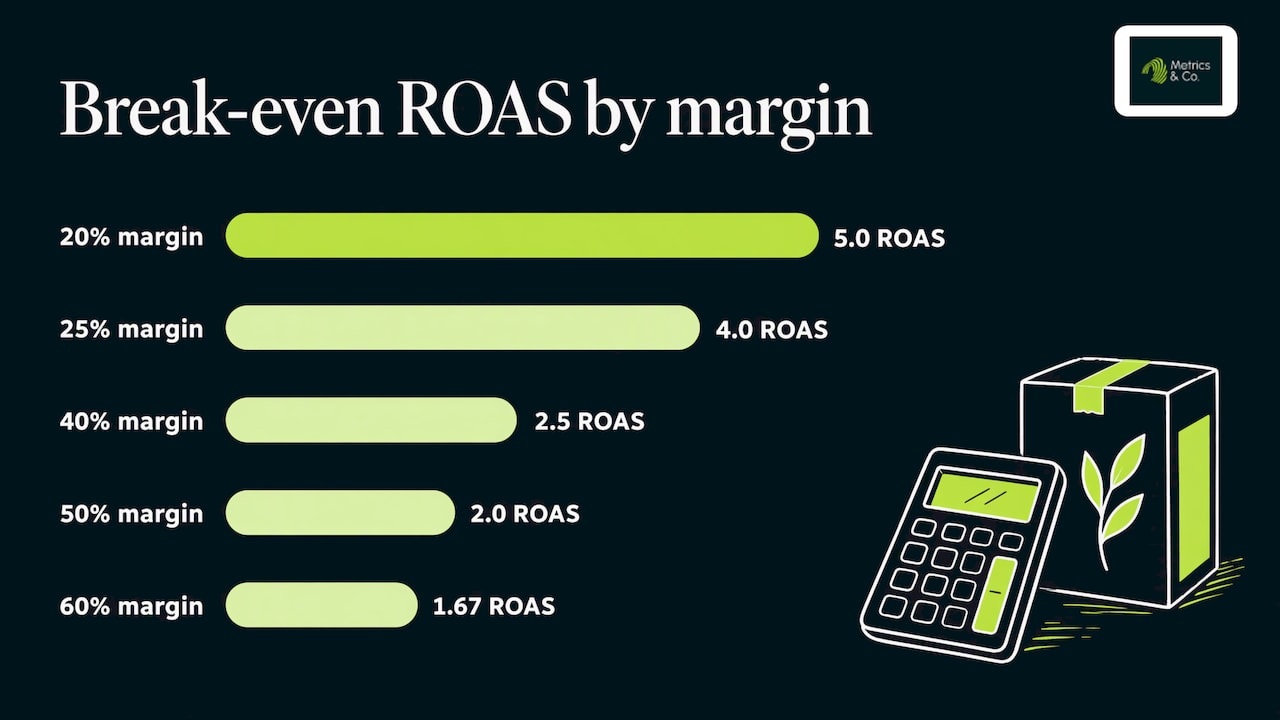
Searches such as “is 2.5 a good ROAS” or “is a ROAS of 1 good” have no universal answer, because the threshold depends on margin. The calculation is straightforward:
Break-even ROAS = 1 ÷ contribution margin
| Contribution margin | Break-even ROAS |
|---|---|
| 20% | 5.0 |
| 25% | 4.0 |
| 40% | 2.5 |
| 50% | 2.0 |
| 60% | 1.67 |
A ROAS of 1.0 means revenue equals ad spend. It is only good when margin is 100%, which is never the case for a physical product and rarely so for a financial service with processing and compliance costs. A 2.5 ROAS breaks even at 40% margin, loses money at 30% and earns at 60%.
Two cautions apply to break-even math:
- It covers variable costs only. Fixed costs such as salaries, rent, software and agency retainers sit outside the contribution calculation, so a business must run above break-even ROAS to make net profit.
- First-order revenue understates value for subscription and trading products. Fintech, crypto exchanges and forex platforms often acquire a customer at a loss on the first transaction and earn through lifetime value. For those models, use a target ROAS or CPA based on projected customer value over a defined window, and state the window and the assumptions behind it.
When to use ROAS, ROI or both
A workable division of labor:
- ROAS for in-platform optimization. Bid strategies, audience tests, creative variants and keyword pruning need a fast signal. ROAS reads in days, and ROI cannot.
- ROI for budget allocation. Deciding whether to move $50,000 from paid social to SEO, to extend a retainer or to enter a new market needs a profit view with all costs in it.
- Both for reporting. Show ROAS next to break-even ROAS for each campaign, then show blended ROI for the program. The first tells a media buyer what to change, the second tells a CFO what to fund.
In regulated verticals the split matters more. Platform restrictions limit which ads can run, compliance review lengthens launch cycles, and attribution is often partial because users research across devices before depositing funds. Evidence, scope and measurement limits should therefore be written down before a campaign starts, so that the number reported at the end is the number the team agreed to judge it by. That is how Metrics & Co. approaches high-stakes markets: buyer objectives, evidence, scope and measurement limits are made explicit before work begins.
ROAS, ROI and the SEO vs PPC decision
The same two metrics are behind the question of organic search vs paid search, and they fit the channels differently.
PPC produces spend and revenue within the same reporting period, so ROAS works well. Costs stop when the budget stops, and so does the traffic.
SEO carries costs up front (technical work, content, links) and returns revenue over many months, so a monthly ROAS understates it early and ignores it later. ROI over a longer window is the better lens.
Research shows how the economics can play out:
- A 2023 academic forecast comparing SEO and PPC across five companies projected SEO/PPC break-even at 15 to 30 months when SEO goal timelines were 9 to 15 months. Faster implementation or greater traffic growth could shorten that, and the model’s assumptions limit its precision.
- A 2025 US luxury-footwear study using one year of Google Analytics and Google Ads data found organic search produced 49,003 sessions, 166 purchases and $80,026.59 in revenue at a 0.34% conversion rate. Paid traffic averaged a $61 cost per acquisition for the year, with a Q4 peak of $137, and holiday-season ROAS exceeded 3.0.
- A 2014 NBER working paper on eBay field experiments found paid-search returns were a fraction of conventional non-experimental estimates, and that non-brand ads positively influenced new and infrequent users, while frequent users accounted for most spend.
The lesson for measurement is that reported ROAS depends on what the platform credits to the ad. Experiments and incrementality tests show how much of that credit is truly additional. Paid and organic also interact: paid search covers launch windows, seasonal peaks and new keywords while organic rankings build, and strong organic pages lower the pressure on paid budgets over time.
A new layer is AI answer visibility, where brands appear in responses from AI search tools. It has no click-based ROAS in the usual sense, so it needs its own leading indicators, such as citation and mention tracking, alongside branded demand and assisted conversions. The relationship between classic and AI visibility is covered in SEO and AEO shared signals.
A reporting setup that holds up
- Define costs once. Decide which items count in total investment: media, agency fees, creative, tools, allocated salaries. Apply the definition to all channels.
- Set break-even ROAS per product or funnel. Different products and account types have different margins, so a single blended target hides losers.
- Track ROAS daily or weekly, ROI monthly or quarterly. Match the metric to its decision cycle.
- Use a consistent attribution rule. Document the model and lookback window and keep them stable when comparing periods.
- Validate with incrementality tests. Geo or holdout tests show how much attributed revenue the ads actually caused, especially for branded terms.
- Add lifetime value where it applies. For deposit, subscription and repeat-purchase models, set a target against projected value over a stated window.
Teams that lack the tracking to do this usually start with analytics and attribution before they scale spend, since every figure above depends on clean revenue and cost data. The comparison of in-house and agency marketing for fintech shows how teams usually split this work.
How Metrics & Co. fits in
Metrics & Co. is a performance marketing agency for crypto, fintech, forex and e-commerce brands. It covers paid advertising, SEO, content, funnel optimization and analytics and tracking under one roof, which puts the ROAS side and the ROI side of the same program in one set of reports. The agency reports over $500 million generated in client revenue and a 25.5x peak return on ad spend.
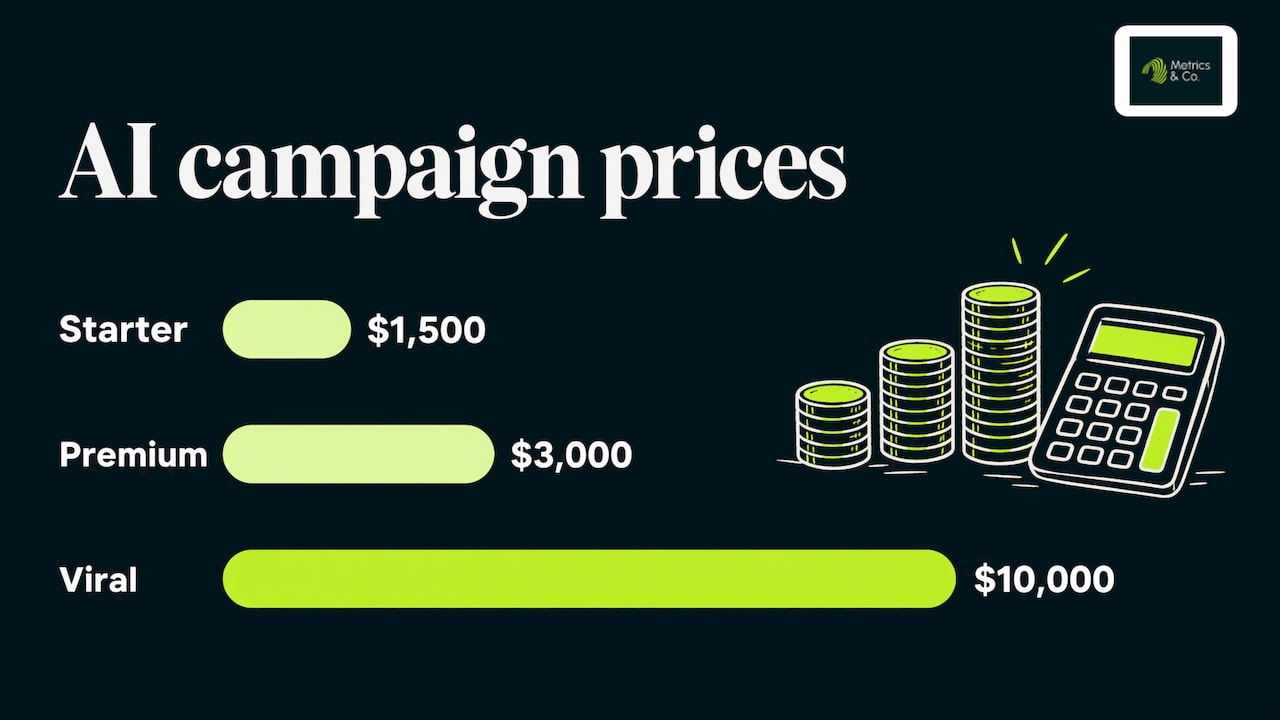
For brands that want to establish visibility in AI search first, there are one-time AI visibility campaigns priced at $1,500 (Starter), $3,000 (Premium) and $10,000 (Viral). Ongoing paid, SEO and content engagements are scoped individually on the services page. E-commerce teams can start from the e-commerce marketing page.
Where margins are tight and measurement is hard, the useful first step is a shared definition of success: break-even ROAS, the cost base behind ROI and the window in which both are judged.
FAQ
Is ROAS the same as ROI?
No. ROAS divides attributed revenue by ad spend. ROI divides net profit by the total investment, including costs beyond advertising. A campaign can have a high ROAS and a negative ROI if margins or other costs are large enough.
Is a 2.5 ROAS good?
It depends on contribution margin. A 2.5 ROAS is exactly break-even at a 40% margin, profitable above that and unprofitable below it. Calculate break-even as 1 ÷ contribution margin and set the target above it to cover fixed costs and profit.
How do you convert ROAS to ROI?
Multiply ROAS by contribution margin, subtract total costs and divide by total investment. For ad spend alone, ROI = (ROAS × contribution margin) − 1. Add agency fees, creative and tooling to the investment figure for a full ROI.
Which is better, SEO or PPC?
Neither wins on every measure. PPC returns revenue quickly and suits ROAS tracking, while SEO builds returns over a longer period and suits ROI over a long window. One academic forecast projected combined break-even at 15 to 30 months, so most brands plan both.
Should crypto and fintech brands use ROAS?
Yes, for campaign optimization, with two additions: a margin-based break-even and a lifetime value view, because first-transaction revenue often understates what a customer is worth. ROI then confirms the program as a whole is profitable.
Sources
- Shopify: ROAS vs. ROI, how to calculate and use each metric
- University of New Hampshire: Digital marketing analytics and calculations
- Amazon Ads: What is return on ad spend
- Smart Insights: Marketing ROI calculator and acquisition essentials
- Monday.com: Marketing ROI, definition, formula and how to measure it
- Comparing the return on investment of SEO and pay-per-click marketing
- NBER working paper w20171: Consumer heterogeneity and paid search effectiveness
- Cost-efficient traffic for luxury shoe e-commerce