
Media mix modeling (MMM) is a statistical method that uses aggregate historical data, such as weekly spend by channel and weekly revenue, to estimate how much each channel contributed to a business outcome. It needs no user-level tracking, which is why it has returned to the agenda of crypto, fintech, forex and e-commerce teams as cookies, consent rules and platform restrictions weaken click-based reporting. At Metrics & Co., we treat it as one tool in a measurement stack: it answers budget questions that attribution cannot, and it only works when the data, the spend variation and the scope are set up properly before the first model runs.
TL;DR
- MMM regresses outcomes (sales, sign-ups, funded accounts) on spend and control variables over time, then estimates each channel’s contribution, diminishing returns and lagged effects.
- It needs aggregate data by channel, by week, over a long enough period with real variation in spend. Flat budgets and very small budgets give weak answers.
- Results are correlational unless the model is calibrated with experiments, so the strongest setups combine MMM, incrementality tests and attribution.
- Marketing mix models include price, product and distribution drivers. Media mix models cover media actions only.
- Before commissioning one, define the decision it will inform, the KPI, the data owner and the limits of what it can say.
Table of Contents
- What media mix modeling measures
- How media mix modeling works
- A worked example of using results for budget allocation
- What MMM cannot tell you on its own
- MMM, attribution and incrementality: which question each answers
- When your team is ready for media mix modeling
- Media mix modeling services: what to expect
- Making the measurement foundation work with Metrics & Co.
- FAQ
- Sources
What media mix modeling measures
A media mix model treats your results as a function of what you spent and what else was going on. According to Google researchers Chan and Perry, these models have existed in various forms since the 1960s and use aggregate historical time series to model sales as a function of advertising, marketing and control variables. The questions they target are practical: what is the return on a given channel, and what happens if budget moves from one channel to another?
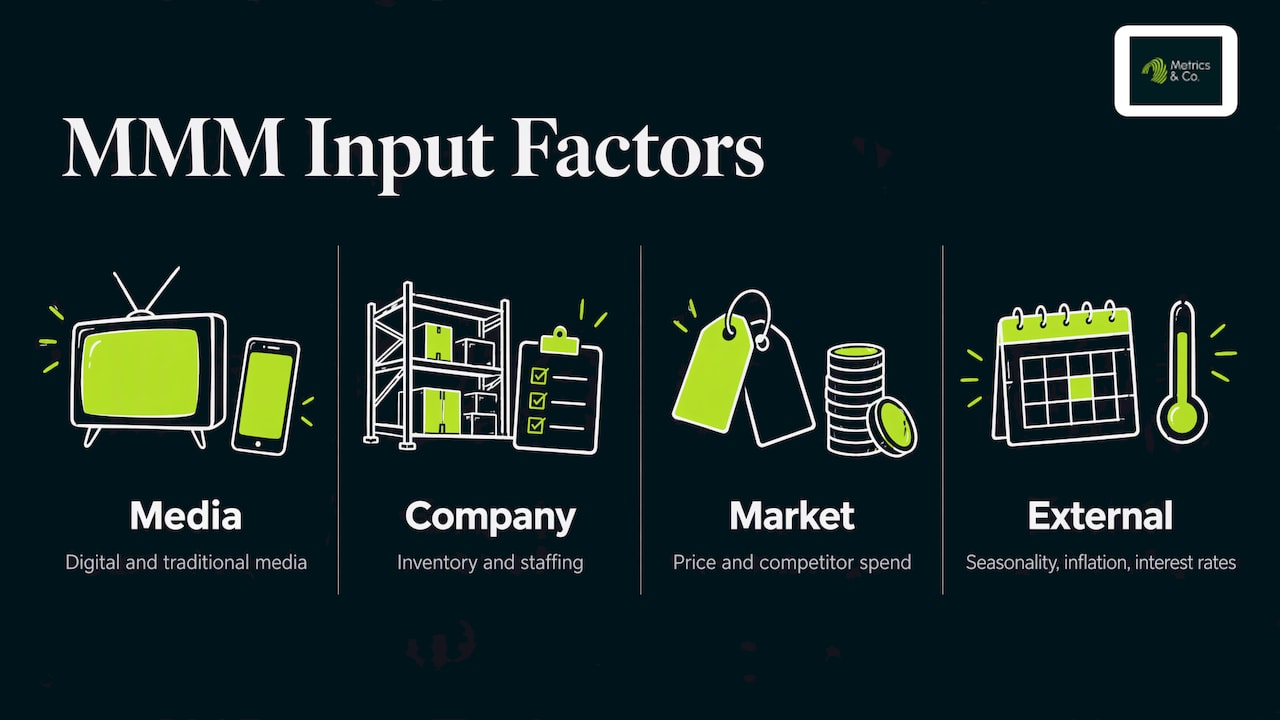
Gartner’s guide to marketing mix modeling describes the goal as determining the incremental impact of marketing activities, using aggregate rather than user-level data. That data can include digital and traditional media, company factors such as inventory and staffing, market forces such as price and competitor spend, and external factors such as seasonality, inflation and interest rates.
For the teams this article is written for, the external factors matter more than they first appear. A crypto exchange’s sign-ups follow market cycles. A forex platform’s volume follows volatility events. A fintech lender’s applications follow interest rates. An e-commerce brand’s revenue follows promotions and holidays. A model that ignores these drivers will credit paid media for demand that the market created.
Marketing mix modeling vs. media mix modeling
The two names are used interchangeably in most conversations, and the acronym is the same. The MSI Blue Ribbon Panel report draws a formal distinction: a marketing mix model predicts demand from broad marketing and business drivers, while a media mix model is restricted to media actions. The panel’s point has a practical consequence. Leaving price, product and distribution out of the model can overstate what advertising returned. If you are planning a model, include pricing changes, fee promotions, product launches and distribution shifts as control variables even when the question is only about media.
How media mix modeling works
The mechanics are less mysterious than the vendor decks suggest. Four components do most of the work.
- Outcome series. One KPI that can be summed over time, such as revenue, first-time deposits, funded accounts or orders.
- Media series. Spend, and ideally exposure metrics such as impressions, for each channel over the same periods.
- Control variables. Price, promotions, seasonality, competitor activity and market conditions.
- Response curves. Mathematical shapes that capture how media behaves. Robyn’s documentation paper notes that saturation curves are commonly used to model diminishing returns, and adstock to capture the lagged effect of advertising.
Diminishing returns are the output a budget holder usually cares about most. The model estimates the point where an extra dollar in a channel returns less than an extra dollar elsewhere. Adstock matters because some media works with a delay: a sponsorship or PR placement in week one can lift sign-ups in weeks two to six.
What data you need
Google’s Meridian documentation lists the required inputs: media exposure metrics by channel, geography and time, matching media spend, control variables and a KPI that can be summed. Revenue per KPI, geo population, reach and frequency, organic media and non-media treatments are optional additions.
The Chan and Perry paper adds detail. Data is typically weekly or monthly, aggregated at the national level, with geo or store level possible. It spans response data, media metrics such as impressions, clicks and spend, marketing metrics such as price and promotion, and control factors such as seasonality and competition. The authors also note that data often ends up at the lowest common denominator of geographic granularity.
A working checklist for a growth team:
| Input | Typical source | Common problem |
|---|---|---|
| Weekly revenue or conversions | Billing system, CRM, exchange back office | KPI definitions change mid-series |
| Spend by channel | Ad platforms, invoices | Agency fees and creative costs left out |
| Impressions or reach | Ad platforms | Different counting rules by platform |
| Pricing and promotions | Product and finance teams | Changes not logged with dates |
| Market and seasonal controls | Public indices, internal calendar | Omitted, so media absorbs the credit |
| Earned and organic activity | SEO, PR and content reports | Treated as free and left out |
Two years of weekly data is a common planning horizon. The number that matters more is variation: the model learns from weeks when spend went up, down or paused.
A worked example of using results for budget allocation
A peer-reviewed 2023 study in the journal Ekonomika, by Fareniuk and Chornous, applied MMM to a large Ukrainian nonfood retailer. It modeled offline and online store traffic as a function of media channels and calculated return on media investment (ROMI) from the regression. TV and digital produced the largest share of traffic and the highest ROMI. The authors recommended adding outdoor as regional media and radio for frequency, and reported a 40% increase in media efficiency and return on media investment from the resulting decision-support tools.
The pattern is transferable even though the sector is different:
- Fit the model to historical data.
- Read contribution and ROMI by channel.
- Check the curves for saturation.
- Move budget toward channels with headroom and away from saturated ones.
- Measure the next period and refit.
Applied to a fintech acquisition budget, the same steps might show that branded search is saturated at current spend while a content and organic program still has room, or that a paid social channel is returning less than its platform dashboard reports. Those are hypotheses to confirm with a test, which leads to the main limitation.
What MMM cannot tell you on its own
The Google paper is direct on this: although MMM attempts causal questions, regression on limited observational data produces correlational results, not causal ones, except under narrow conditions. Its authors also say estimates are more trustworthy when there is enough data and useful variability in advertising levels and control variables.
The IAB’s 2019 guidebook on MMM and multi-touch attribution adds two cases where MMM is the wrong approach: a continuous flight at the same weight, and variation outside historic bounds. Without meaningful variation in spend, the model cannot separate one channel’s effect from another’s.
The IAB’s December 2025 report, Modernizing MMM, makes a related point. Legacy MMM was built for annual planning cycles and centralized data in a world where TV dominated, so older models often underrepresented newer, fragmented channels. The report sets out best practices to make MMM timely, auditable and decision-ready. For performance teams that change creative, bids and channels monthly, an annual deliverable is too slow to act on.
Practical consequences for regulated and fast-moving categories:
- Budgets that never change give no signal. If spend is the same every week, plan deliberate variation, such as staged increases by market, before relying on a model.
- Launches and regulatory events distort the series. A token listing, an exchange outage or a change in ad-platform policy should be logged as an event and included as a control.
- Small budgets are better served by other methods. Where spend is modest, controlled tests of single channels usually give clearer answers.
MMM, attribution and incrementality: which question each answers
These methods are complements, not rivals.
| Method | Question it answers | Data | Strength | Limit |
|---|---|---|---|---|
| Media mix modeling | How should budget be split across channels? | Aggregate spend and outcomes over time | Covers offline and untrackable media, no user-level data | Correlational, needs spend variation |
| Multi-touch attribution | Which touchpoints sit on converting paths? | User-level journeys | Fast, granular, campaign-level | Depends on trackable journeys |
| Incrementality tests | Did this channel cause conversions that would not otherwise happen? | Experiments with holdouts | Closest to causal evidence | One channel at a time, needs design |
Our guide to multi-touch attribution models, setup and limits covers the user-level side. For the experimental side, in a category where branded search often looks efficient because it captures demand created elsewhere, see how to measure crypto brand search incrementality. A sound program uses the experiment result to calibrate the model, and the model to decide where the next experiment goes.
MMM can also include channels that click-based reporting misses. Earned and organic activity such as PR coverage and content is one example. If you track earned media metrics, those weekly series can enter the model as additional inputs rather than being left out as free.
When your team is ready for media mix modeling
Use this screen before you commit time or budget.
- A decision is waiting. There is a budget allocation, a market entry or a channel cut that the result will inform.
- Spend is spread across several channels. Paid search, paid social, affiliates, sponsorships, PR and organic all contribute, and platform reports overlap.
- History exists. You have a long weekly record with spend changes in it.
- Tracking is weakening. Consent rules, privacy settings or ad policy limits have reduced what click-based tools can see.
- Data is accessible. Finance, product and marketing can supply consistent series.
For teams that fail the screen, the work starts earlier: consistent event tracking, clean KPI definitions and a log of spend changes. These are the same foundations that attribution and funnel reporting need.
Media mix modeling services: what to expect
A services engagement generally covers a few stages: scoping the business question, collecting and cleaning data, building and validating the model, translating results into budget scenarios, and refreshing the model on a regular schedule. The deliverable that matters is not the model file but the decision: a recommended allocation with a range around it and a plan for what to test next.
When you brief any provider, ask for these in writing:
- The business decision and the KPI the model will use.
- The data sources, owners and time window.
- The control variables and how events will be coded.
- How the model will be validated, and how it will be calibrated with experiments.
- The refresh cadence, so results arrive while they can still change spend.
- The limits of the findings, stated before work starts.
That last item is where regulated categories need the most care. Crypto, forex and fintech brands operate under advertising rules that differ by jurisdiction, and platform policies restrict which campaigns can run at all. Those constraints shape what variation in spend is possible, so they belong in the scope. Our guides on forex marketing across jurisdictions and paid media strategy for regulated growth teams cover how those constraints affect planning.
Making the measurement foundation work with Metrics & Co.
MMM is only as good as the tracking, reporting and campaign structure underneath it. Metrics & Co. works with crypto, fintech, forex and e-commerce teams on paid acquisition, SEO, AI search optimization, content, funnel optimization and analytics, with attribution reporting among its capabilities. Our approach is to make buyer objectives, evidence, scope and measurement limits explicit before work begins, so that a number in a report can be traced to what it does and does not show.
If you are deciding how to split a budget across paid and organic channels, or setting up the data that a model will need, start from our services overview or the paid advertising page for crypto, fintech and forex.

E-commerce teams can see how paid acquisition, SEO and AI visibility fit together on our e-commerce marketing page.
FAQ
What is an example of a media mix model?
A model might take 104 weeks of revenue as the outcome and weekly spend on search, social, affiliates and PR as inputs, with price changes and seasonality as controls. It then estimates each channel’s contribution and its saturation point. The published retail study by Fareniuk and Chornous follows this logic and used the resulting ROMI figures to recommend adding outdoor and radio to the mix.
What is the difference between MMM and multi-touch attribution?
MMM works from aggregate spend and outcomes over time and does not need user-level data. Multi-touch attribution assigns credit to touchpoints along individual converting journeys. MMM suits budget allocation across channels, while attribution suits campaign-level optimization where journeys are trackable.
How much data and budget do you need?
You need a consistent weekly or monthly series for the outcome, spend by channel and control variables, with real changes in spend over the period. The IAB’s guidance notes that a continuous flight at the same weight is not suited to MMM. Teams with flat or very small budgets typically get clearer answers from controlled channel tests first.
Is marketing mix modeling the same as media mix modeling?
The terms are used interchangeably in practice. In the MSI Blue Ribbon Panel’s definition, a marketing mix model covers broad drivers such as price, product and distribution, while a media mix model covers media actions only.
Sources
- Challenges and Opportunities in Media Mix Modeling (Chan and Perry, Google, 2017)
- A CMO’s Guide to Marketing Mix Modeling (Gartner)
- MSI Blue Ribbon Panel Report on marketing mix modeling
- Packaging Up Media Mix Modeling: An Introduction to Robyn (arXiv)
- Collect and organize your data (Google Meridian documentation)
- Optimization of Media Strategy via Marketing Mix Modeling (Fareniuk and Chornous, 2023)
- The Essential Guide to Marketing Mix Modeling and Multi-Touch Attribution (IAB, 2019)
- Modernizing MMM (IAB, December 2025)
- Earned Media Metrics: What to Track and How to Report
Metrics & Co. is a performance marketing agency for crypto, fintech, forex and e-commerce brands, combining analytics-driven paid acquisition, SEO, AI search optimization and content. Learn more at metricsandco.com.